Now that nearly all of the election “dust” has settled, it is appropriate to revisit the results of the final round of pre-election presidential contest polls that were presented in my last piece. In doing this I shall compare them with the official/IEBC results and attempt to explain the apparent contrasts.
But has nearly all the ‘dust’ really settled?
Before undertaking the main task at hand—analysing the degree to which the last round(s) of surveys generated presidential results that were reflected in those declared by IEBC Chair Wafula Chebukati—it seems necessary to explain the delay in finishing this piece for The Elephant.
Ever since the return of election polls ( themselves coming in the wake of the return to multi-party competition in the 1990s) a major challenge in assessing their accuracy has been the credibility-deficit often associated with the official results. Leaving aside the assumed willingness of survey respondents to “honestly” reveal their voting intentions, as well as the impossibility to exactly predict voter turnout, a number of factors have been identified—and on some occasions, well documented—including: the buying of IDs/voters’ cards, threats to/physical obstruction of would-be voters, intimidation of/interference with campaign activities, ballot-stuffing, and fraudulent vote-counting. As such, one survey firm that had undertaken pre-election polling since 1997 decided prior to the 2013 contest not to do this (at least for public release) “until and unless we are confident that the official results are credible”—although just how this might be determined raises additional issues.
For last year’s election as related to this piece that seeks to assess the accuracy of survey results, it was thus necessary to wait to see if any credible evidence emerged that might at least cast doubt on the official presidential results, especially since, as shown below, nearly all of the final pre-election survey results were “wrong”—that is, not just showing a “different” candidate winning, but also doing so by a figure that was well outside the margins-of-error of the reported polls. The author therefore paid close attention first to whatever grounds the four dissenting IEBC commissioners had for refusing to confirm the results announced by their chairman, and then to the nine “consolidated” petitions that were taken to the Supreme Court, and the issues that the Court sought to scrutinize and determine. However, the commissioners remained silent, with three of them subsequently resigning, apparently to avoid interrogation by the tribunal established by the president following its authorization by the Kenya Kwanza majority in the National Assembly. Court proceedings also yielded far from sufficient evidence to “prove” that the election was “stolen”, even if not all of the arguments used to overcome these petition challenges were entirely convincing.
As such, it was possible to complete a draft of this piece within several months of the election. However, almost immediately thereafter, one of the IEBC commissioners, Ms Irene Masit, declared that rather than resign as did her three “dissenting” colleagues, she would contest her possible removal through the above-noted tribunal . In this context, shortly before her first scheduled appearance before it, she announced her intention (in mid-December) to release a “bombshell” about the official presidential results. It was, therefore, rather an anti-climax when she failed to appear at the hearing, instead sending her lawyer, the focus of whose complaint was the composition of the tribunal rather than any substantive refutation of the results. Indeed, despite several additional tribunal sittings, no such “bombshell” was ever dropped, with Masit remaining silent throughout (even if doing so may have contributed to the tribunal’s ultimate decision to recommend her removal from office), leaving the motivation behind her initial statement quite up in the air.
On the other hand, a different “explosive device” was lobbed by Raila Odinga on 18 January—and repeated several times thereafter in several public rallies and press statements: that a “whistle-blower” from within the IEBC had made available the full constituency results of the presidential contest (which are yet to be posted on the IEBC’s website) showing that Odinga had won with a margin of over two million votes, giving him some 57 per cent of all votes cast. Just why it had taken so long for these “true results” to be made available (either by the ‘whistle-blower’, or by Azimio depending upon when they were provided) was never explained, however, and a rigorous scrutiny of them by a long-term observer-analyst of Kenyan elections, Dr Charles Hornsby, cast serious doubt about their credibility. Central here was his comparison of the supposedly “true” presidential tallies in a number of key constituencies (“key” in the sense that these results amounted to a complete reversal of the official presidential figures), but where, almost without exception, the parliamentary results, none of which the “whistle-blower” sought to refute, amounted to overwhelming victories for Ruto’s UDA party and its affiliates, thus making such reversed presidential results incredulous. (It is also curious why Masit remained silent about them, whether during the tribunal’s hearings or at any other time, as well as why the “whistle-blower” had not made them available to her or to any of the other dissenting commissioners before they resigned—assuming this was the case.)
Just why it had taken so long for these “true results” to be made available by Azimio was never explained.
Even more recently, the investigative and civic education NGO, Inform Action, released a report that assessed the degree to which last year’s election met the standards demanded by the constitution and relevant statutes. While it identified numerous failings at all stages of the electoral process, none was identified as having significantly affected the presidential results.
In sum, then, no incontrovertible evidence has come to light since the election that calls into question the validity of the declaration of William Ruto as the winner. This includes the claim, also made on several occasions by Azimio leaders, that an exit poll confirmed the results released by the IEBC “whistle-blower”. Yet no figures were released in connection with this poll , let alone the identity of the agency that conducted it or any details of the methodology used (i.e., sample size and distribution across which polling stations, the number and wording of the questions asked, the proportion invited to be interviewed who refused and their distribution over the map, etc.) Such doubts were magnified by the fact that (especially if the results were favourable to Odinga) the results were not released immediately all the polling stations had closed, as is the general case globally, or at least prior to the announcement of the official results five days later. Further, an effort to obtain such information by writing to a senior Azimio official yielded no fruit. (Why various media interviews with Azimio leaders since this claim was first made failed to raise any of these questions is also curious.)
No incontrovertible evidence has come to light since the election that calls into question the validity of the declaration of William Ruto as the winner.
With this context (which, it should be noted, however, is at least potentially subject to change), the main issue examined in this piece can be addressed: what (if anything) can explain the significant gap between nearly all of the final round of polls and the official results?
Were the pollsters ‘wrong again’?
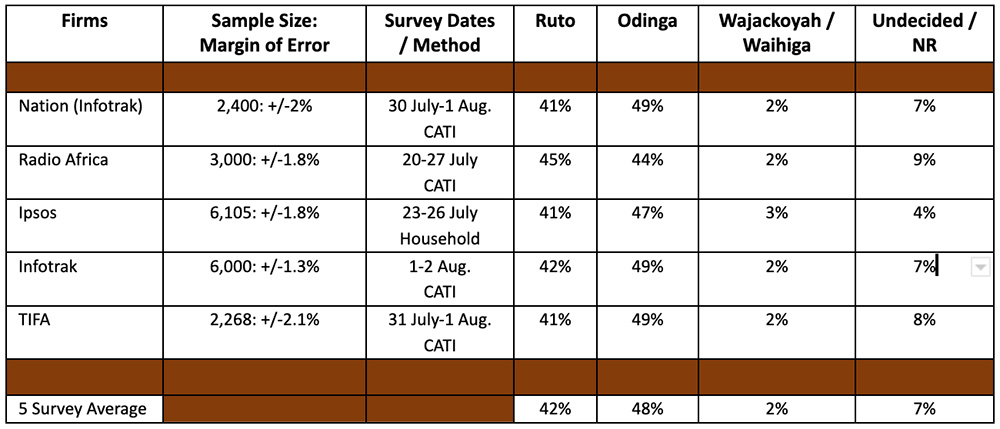
Notwithstanding the usual disclaimers from survey firm representatives that their results were “snapshots-in-time” rather than predictions, questions about the accuracy of their work arose immediately enough constituency-level results had been tallied to indicate that even if Odinga was going to emerge the winner—or even whether either he or Ruto would get over the 50 per cent + 1 hurdle—the margin between these two main contenders was going to be far smaller than the final polls had indicated, with one exception: that of Radio Africa, the only one that put Ruto in the lead, although within that poll’s margin of error, as indicated in the following table containing all these results as well as their collective average:
Moreover, and as I have noted in previous pieces in this series, since ballots do not provide any “undecided” or “no response” options (and those left unmarked or spoilt by any “stray” marks are removed from the total of “valid votes cast” that is used to calculate the 50 per cent + 1 requirement), it would make sense this close to an election to also calculate survey results with those no-named-candidate results removed, which are presented in the table below for TIFA (and which were included in its 3 August media release) and the five-survey average, as well as the official/IEBC results:
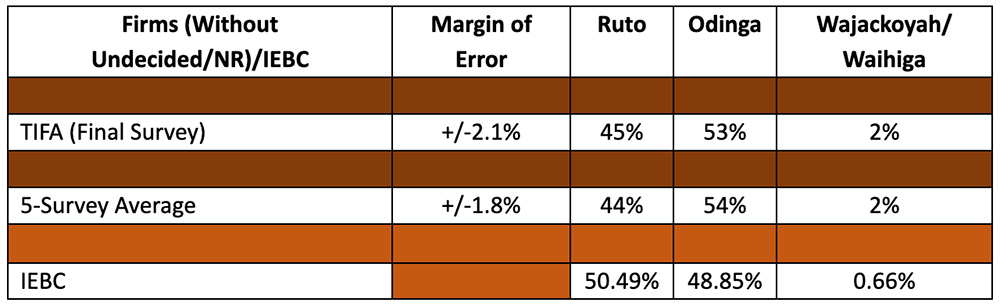
In other words, Ruto obtained about 6.5 per cent more votes than his five-poll average of 44 per cent, and Odinga obtained about 5 per cent less than his average of 54 per cent.
So, what might explain this “error”? (And note that the margin of error in none of these “incorrect” polls does so.) To answer this question, five factors will be considered: the “evaporation” of expressed support for the two minor candidates; the postponement of gubernatorial contests in two counties; the variable distribution of voter turnout; respondent dishonesty; and a possible late “wave” in Ruto’s favour.
Factor one: burst of the Wajackoyah ‘balloon’
I had previously suggested that the expressed intention to vote for George Wajackoyah—which was recorded at 4 per cent in TIFA’s late June survey—could have been largely “for fun”, and that some, if not most, of those respondents who actually vote would bring themselves to choose between the only two serious contenders.
That this was a likely scenario was suggested by the drop in expressed support for him by more than half (to 1.8 per cent) in TIFA’s final pre-election survey. Given the fact that—as was the case previously—in that survey Ruto had rather more support among voters under 35 and that Wajackoyah had nearly three times more support among such voters than among the more elderly, it can be assumed that on 9 August, Ruto was the main beneficiary of the “evaporation” of Wajackoyah’s votes to less than 0.5 per cent.
Factor two: the two postponed gubernatorial contests
A second factor is the failure to hold elections for governor in two counties where Odinga received clear majorities. As may be recalled, it was immediately clear on 9 August that there had been a “mix-up” of the gubernatorial ballot papers in Mombasa and Kakamega counties, with the candidates’ images on the ballots failing to match their names. This meant that the elections for these positions had to be postponed, raising the question as to how much that might depress voter turnout in these two counties. That this was a concern on the Azimio side was evident when Mvita MP and ODM gubernatorial candidate, Abdulswamad Nassir, cried foul on the basis that these “are all ODM strongholds and we read ill-motive to reduce the number of votes in favour of Raila Odinga”, an allegation also contained in one of the Supreme Court election petitions subsequently filed on Odinga’s behalf.
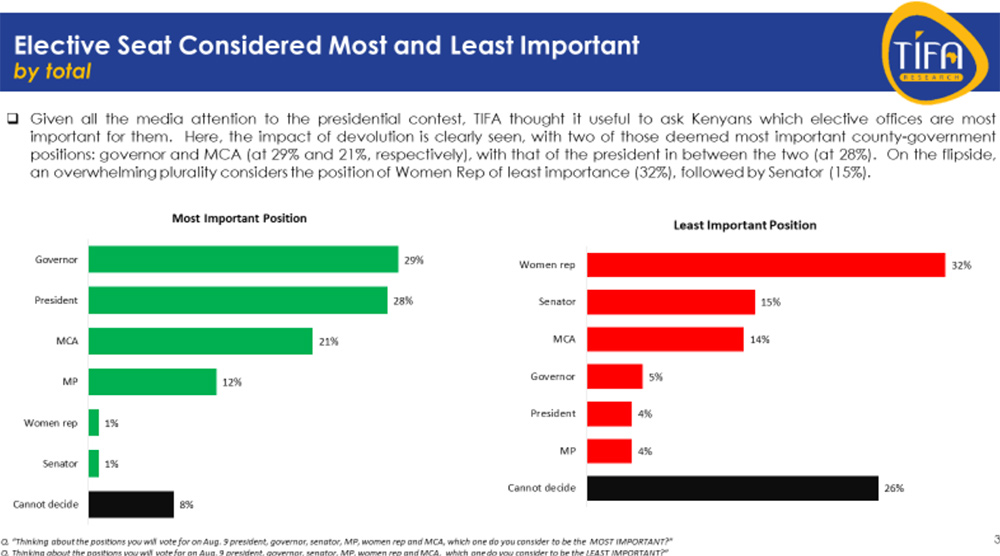
Buttressing Azimio’s argument (though not mentioned in the petition) were the results of a question in TIFA’s final pre-election survey, released on 3 August, which revealed that Kenyan voters perceived the importance of the position of governor as equal to that of president, and thus its absence from the ballot would most certainly have a negative impact on voter motivation.
In its full judgment, the Supreme Court, having first affirmed the IEBC’s authority to postpone elections under various conditions including those at issue here, held that the petitioners had failed to prove that the postponement led to a suppression of voter turnout, and that it was motivated by malice.
Leaving aside the second point about any “malice or bad faith”, a more precise estimate than that which was presented to the Supreme Court helps to reveal the extent to which voter turnout in these two counties was, in fact, depressed, and how this impacted on the presidential results in those counties.
In answering these questions, a more detailed review of the presidential election results is helpful. First, according to the IEBC, 65.1 per cent of nationally registered voters cast votes, 99.2 per cent of which were valid, making a total of 14,213,137 valid votes. Of these, 50.49 per cent were cast for Ruto and 48.85 per cent for Odinga. Ruto’s total was based on receiving 233,211 more votes than Odinga, and 69,573 votes above the 50 per cent + 1 required for an outright win. However, national turnout was rather lower than it was in the 2017 election (77 per cent). Among several national level factors that may account for this, most widely acknowledged was the absence of a serious presidential candidate from the Mt. Kenya region, so that voter turnout there was 15 per cent below the 2017 figure.
Kenyan voters perceived the importance of the position of governor as equal to that of president.
With specific regard to Kakamega and Mombasa, five years ago the turnout was 75 per cent in the former and 59 per cent in the latter. This time, apparently (but not conclusively) due to the absence of gubernatorial ballots, these figures were 60 per cent and 44 per cent, respectively. By comparison, the average for the other four counties in the western region was 64 per cent, and in the other five coastal region counties, 59 per cent, both considerably higher than in the two counties at issue.
At the Supreme Court, however, the petitioners used an average turnout of 72 per cent for the last three elections in Kakamega, and posited an average of 56 per cent in Mombasa, yielding a 12 per cent turnout gap in both counties on 9 August. However, given the credibility issues regarding voter turnout in previous elections, using regional county averages from 2022 as well as the differentials between Kakamega and the rest of western and between Mombasa and the rest of the coast region, yields a more accurate estimate of what the turnout in these two counties would likely have been had all six positions been on the ballot.
In order to arrive at such an estimate, the difference in average turnout in the 2017 and 2022 elections for the counties in each of the two regions—aside from the two at issue—was calculated. For the western region, aside from Kakamega, turnout in 2022 was 12.1 per cent below what it was in 2017. Based on this reality, since turnout in Kakamega in 2017 was 74.9 per cent when all six positions were on the ballot, it may be assumed that in 2022 it would have been about 63 per cent, or 3 per cent higher than the 60.3 per cent recorded on 9 August.
A similar calculation for the coast region (leaving aside Mombasa) yields a figure that is 11.2 per cent below the 2017 level for its five other counties. As such, taking into account that turnout in Mombasa in 2017 was about 9 per cent lower than it was in the region as a whole (60.0 per cent), it appears that in 2022 it would have been 51 per cent. However, given that the 2022 gubernatorial contest was considerably more competitive (in which Abdulswamad Nassir of ODM defeated Hassan Omar of UDA by a mere 20,000 votes) than in 2017, a slightly higher turnout may be assumed compared to 2017 when Ali Hassan Joho had no serious challenger. Thus, perhaps 53 per cent is a more likely figure, about 9 per cent higher than what occurred on 9 August.
Based on the above pair of assumptions, the disadvantage Odinga suffered through these two postponements can be estimated. For Mombasa, 9 per cent of all registered voters represents 57,813 votes. Assuming that these “extra” votes would have been split in the same proportions as were the votes that were cast on 9 August, Odinga (having obtained 58.07 per cent) would have garnered an additional 33,571 votes, and Ruto (who obtained 41 per cent) an additional 23,702 votes. Similarly, in Kakamega, Odinga would have garnered an additional 18,002 votes, and Ruto an additional 7,101 votes, had voter turnout been 3 per cent higher.
Taking these “lost” votes into account, the national totals for both candidates would therefore have risen to 7,206,944 for Ruto and 6,994,503 for Odinga. The quite modest gain for Odinga thereby reduces the overall gap between them from 233,211 to 212,441. Further, if we assume that the two other candidates would between them have gained another 800 or so votes (based on totals of 0.93 per cent in both counties, giving them a combined national total of 94,756), that would have brought the total national vote to around 14,296,000 valid votes. This, in turn, means that Ruto would have obtained about 50.41 per cent of all valid votes (rather than 50.49 per cent), while Odinga would have obtained 48.93 per cent (rather than 48.85 per cent). Overall, these figures would have slightly narrowed Ruto’s margin above 50 per cent: from 69,573 to 58,944 votes.
As can be seen, these calculations do not affect the overall result, but they are measurable, and it may be asked why the petitioners were not more precise in their submission to the Court, if they were going to be presented at all. At the same time, given the dismissive language in the Supreme Court’s eventual full judgment, it is unclear how large such a turnout gap would have had to be in order for this aspect of the IEBC’s performance to be taken into account, or whether any such gap would have been enough to force such a consideration unless one or more petitioners could have convinced the Court that such errors were deliberate as opposed to being only “accidental” ballot-printing errors by the Greek firm that supplied them.
Factor three: turnout differential – Ruto vs. Odinga ‘strongholds’
The next and potentially much weightier “suspect” for the pollsters’ “error” is national voter turnout, as TIFA emphasized in a “Cautionary Note” that accompanied its 3 August media release: “The outcome of the election depends on voter turnout and this cannot be predicted by surveys.” Even earlier, in several of its pre-election survey-release, TIFA had also made clear that far more respondents were claiming to be registered voters than was indicated by the IEBC’s figures. For example, in its second-to-last pre-election survey (conducted at the household level from 21 to 26 July), 93 per cent of randomly selected respondents claimed to be registered voters, yet based on the adult population as identified in the 2019 Census plus the youth who came of age since the last voter registration exercise was concluded in February of last year, the correct figure is only slightly aove 80 per cent.
Such a “reality-check” is bolstered by comparing the proportions among those claiming to be registered voters in the nine zones used by TIFA in presenting its findings who stated that they would “definitely” or “probably” vote with the IEBC’s actual – and significantly lower – figures:
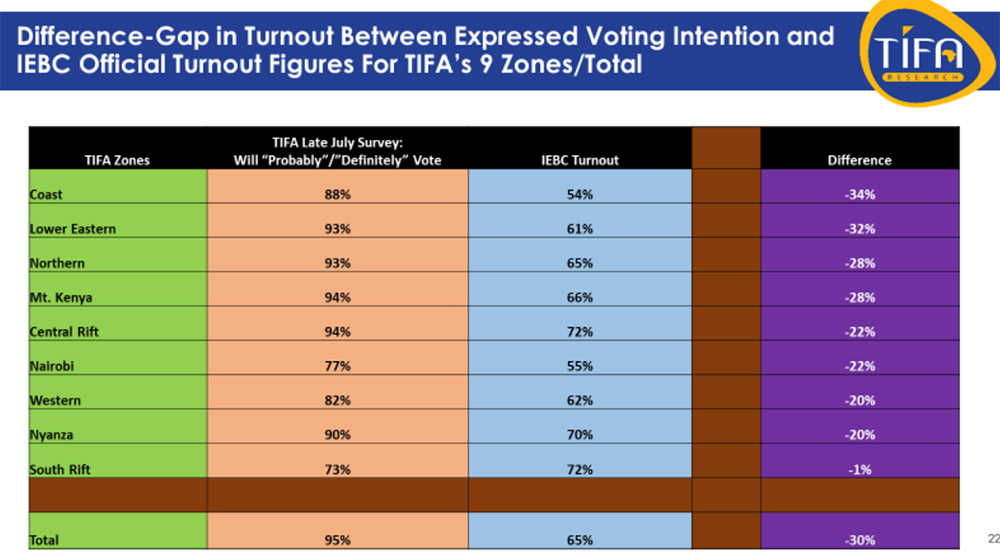
As shown, while the national level gap is a hefty 30 per cent, it varies across these 9 zones from a high of 34 per cent in the coast region to just 1 per cent in the South Rift. The key question, therefore, is to what extent the variations in actual voter turnout explain TIFA’s (and several other firms’) “erroneous” final survey figures.
To answer it, we can first look at the voter intention figures from the same late late July TIFA survey and compare these with the percentages actually won by each candidate in the nine zones:
 In doing so, several points emerge. First, in the respective home-zone areas (Nyanza and Central Rift) of the two main presidential candidates, the gaps between TIFA’s results and those of the IEBC are minimal (i.e., only 2 per cent higher in Nyanza, and only 1 per cent lower in Central Rift). Second, Ruto did almost as well in the second zone in which he obtained a majority—Mt. Kenya—as he did “at home”: 79 per cent vs. 83 per cent, only a 4 per cent difference. By contrast, in the zone where Odinga obtained his second largest majority—Lower Eastern—his majority was considerably smaller than it was “at home”: 75 per cent vs. 87 per cent, a 12 per cent difference. As has been noted, Odinga’s running-mate in this election came from Mt. Kenya region, as did Ruto’s, and not from Lower Eastern, the home of Kalonzo Musyoka who had been his running-mate in the previous two elections. Third and finally, Odinga suffered decreases in his actual vote proportions as compared with his TIFA figures in two zones – South Rift and Nairobi—amounting to 18 per cent in total, whereas Ruto’s negative difference-gap in Central Rift was only 1 per cent.
It is unclear how large such a turnout gap in Mombasa and Kakamega would have had to be in order for this aspect of the IEBC’s performance to be taken into account by the Supreme Court.
With these contrasting regional results in mind, does differential voter turnout explain any of the pollsters’ pre-election “error”? The simple answer is “yes”, but to what extent requires another “deep dive” into the official/IEBC data.
First of all, of all 48 electoral units, Odinga obtained more votes than Ruto in 28 (27 counties plus the Diaspora), leaving 20 counties in which Ruto out-scored him. In the former category, there were 7,968,238 valid votes, while in the latter there were 6,244,799. However, whereas Odinga obtained only 70.6 per cent of all valid votes in his “dominant” areas, Ruto obtained 78.3 per cent in his. Or to put it the other way round, while Ruto obtained 28.7 per cent of all valid votes in Odinga-dominant areas, Odinga managed only 21.1 per cent in Ruto-majority areas. In terms of actual votes, Odinga got 5,627,630 votes in his “strongholds”, while Ruto garnered 4,889,909 in his. However, what got Ruto over the line is that while Odinga obtained only 1,315,300 votes in Ruto’s areas, Ruto obtained 2,286,232 in Odinga’s.
What got Ruto over the line is that while Odinga obtained only 1,315,300 votes in Ruto’sareas, Ruto obtained 2,286,232 in Odinga’s.
Such figures underscore the importance of voter turnout in explaining Ruto’s advantage. Specifically, whereas it was about 69 per cent in the 20 Ruto-dominant counties, it was only about 62 per cent in Odinga’s 27 (leaving out the few Diaspora voters).
This analysis can be extended by answering another specific hypothetical question: what would the results have been if voter turnout had been identical to the national average of 65.1 per cent in all 47 counties? In terms of votes, Odinga would have obtained 7,140,924 as compared to Ruto’s 7,078,521 (with the remaining 98,319 divided between Wajackoyah and Mwaure), thereby pushing the former up to 49.9 per cent vs. 49.8 per cent for Ruto. Further, when Odinga’s “lost” votes from Kakamega and Mombasa are added, his total would have stood at 50.3 per cent as opposed to 49.7 per cent for Ruto, giving the former an outright/first round win, though with a victory-margin of just over 0.5 per cent, almost equal to that of Ruto’s official win, although still less than what nearly all of the final polls reported. Why so many more of Odinga’s potential voters failed to show up at their polling stations on 9 August is a question I shall leave for others to answer.
Factor four: respondent dishonesty
An additional factor that could help to explain the discrepancy between the last round of polls (average) and the official results is respondent dishonesty. It is of two types: unfulfilled intentions and outright falsehood. An example of the latter, as noted above, is respondents claiming to be registered who in fact were not, and thus never voted. Indeed, in selecting respondents for its two final pre-election surveys, TIFA excluded those who “confessed” to not being registered, although it was not possible to verify the registration claims of the remainder, let alone to match those non-voters with their expressed presidential voting intentions.
TIFA sought to identify the “liars” in its July survey, which was conducted in person at residences, by asking all respondents to name their polling stations, but only 94 per cent could do so. Here it should be recalled that in terms of expressed presidential vote-choice in that survey, Odinga out-scored Ruto by 46.7 per cent to 44.4 per cent, a 2.3 per cent difference. Yet when results are limited to those who could name their polling station, Odinga’s lead shrinks to just 0.2 per cent, from 46.4 per cent to 46.2 per cent, suggesting that there was more “dishonesty” about being registered among Odinga supporters. Moreover, the likelihood that, in comparison with the TIFA findings, Odinga “lost votes” by such dishonesty is also suggested by the fact that among those who failed to name their polling station, far more expressed voting intentions for Odinga than for Ruto (53 per cent vs. 19 per cent), and that another 19 per cent said they were “undecided” as to whom they would vote for, as compared with only 5 per cent among those who did name their polling station.
One other factor that could explain part of the discrepancy between the last round of polls (average) and the official results is respondent dishonesty.
(At the same time, asked about their likelihood of voting, the combined figures of “will probably not” and “not sure” are the same for those expressing vote-support for both Odinga and Ruto—3 per cent—countering an assumption that those not registered would be more likely to express doubts about their participation in the election at all. In light of such issues, it is unfortunate there was no exit poll even if limited to a few counties, since ipso facto it would have involved only actual voters.)
The above analysis leads to an obvious question: why would at least a significant number of survey respondents have claimed they would vote for Odinga when they had decided otherwise? While this issue could be explored in subsequent surveys, at this point two closely related factors seem to have encouraged at least some “dishonesty” of this nature. One is the visible support given to Odinga’s campaign by the incumbent Uhuru Kenyatta government, which according to reliable reports, involved both financial and rhetorical support, the latter including exhortations, if not clear threats, by local administration officials. While the impact of such direct involvement on voting is unclear, it seems reasonable to conclude that it served to intimidate at least some respondents, making them uneasy about declaring their intentions to vote for Ruto even in surveys conducted by non-state entities.
Such a conclusion is suggested by the responses TIFA obtained in its April survey to a question (that had also been included in five previous surveys) asking which presidential candidate, if any, respondents thought President Kenyatta supported. Overall, 73 per cent named Odinga. However, rather more of those expressing an intention to vote for him held this view than did those stating they would vote for Ruto (85 per cent vs. 79 per cent). In other words, the fact that more of Odinga’s expressed supporters believed the incumbent president was supporting him than did Ruto’s may have really been an indication that they were not being “honest” but rather sought to align themselves with incumbent presidential power.
Such ‘unease’ is also indicated by the finding in TIFA’s late-July survey that found that among the substantial minority of those who reported having voted for Odinga in 2017 but who intended to vote for Ruto in this election, two-thirds explained their ‘defection’ from him as a consequence of his ‘handshake’ with President Kenyatta. As such, even those still stating they would vote for him may have likewise had this as their main motivation for not doing so, but not wanting to ‘confess’ the same to TIFA and other survey firms.
Another related factor is the widespread assumption that Odinga, being the recipient of such state support, would inevitably win (which likewise appears to have contributed to lower turnout in Odinga “strongholds” as already suggested). As such, even some of those committed to voting for Ruto were likely reluctant to risk getting on the “wrong side” of an expected Odinga government by declaring their true voting intentions, even to private/independent survey firms such as TIFA.
Further, in TIFA’s final survey, a total of 7 per cent of respondents declined to identify their presidential voting intentions, with 4 per cent claiming to be “undecided” and the rest simply remaining silent. Even if 78 per cent of those without a stated presidential vote-preference also failed to identify with any political party (thus suggesting a general lack of interest in politics and thus a lower likelihood of voting at all), this proportion on their own could have been enough to eliminate the polls-vs.-IEBC gap between Odinga and Ruto, and then some.
Factor five: a possible ‘late wave’
Aside from “dishonesty” among those 7 per cent in TIFA’s final survey who declined to reveal their presidential voting intentions, it is possible not only that some of them failed to vote at all, but that others only made up their minds at “the last minute”. Moreover, a small proportion who had honestly expressed an intention to vote for Odinga changed their minds in the intervening period between these final surveys and 9 August, for whatever reasons, and voted for Ruto. Recall here that according to The Publication of Electoral Polls Act (2012), no such results can be published within five days before election day. This means that even the last such survey undertaken and released in this election cycle was completed a full week before that day. In this case, also, it should be possible to identify at least some of these “last-minute” decision-makers in a post-election survey. And several commentators and political actors indicated that such a “wave” was likely, and after the election, that it did, in fact, occur.
For example, just a week before the election, during a discussion of the most recent polls on one of the morning TV political talk-shows, Dr Peter Kagwanja dismissed Odinga’s modest lead by claiming that in the Mt. Kenya region, at least, “You will see a major swing towards Odinga when the votes are tallied because people from this area, not having a presidential contender for the first time, are determined to be where power will be for the next five years, and it is clear that will be an Azimio government.” But such a “swing” could have been in the opposite direction.
Indeed, several weeks after the election, one senior Kenya Kwanza leader from this region claimed to the author that “in our final rallies, we could feel the surge in our direction, such as at Kirigiti in Kiambu, which was our last big rally.”
Altogether, then, while impossible to substantiate without further post-election research, such a ‘late wave’ cannot be ruled out, and to the extent it did occur during the final week, it could not have been captured in the final surveys, once again highlighting the value of an election day exit poll.
A few longer-term take-aways
While each of the five factors examined above could have contributed to Odinga’s loss, it is not possible to precisely measure their impact (even if an attempt was made to do so with regard to the second and third of these). The question that remains is whether, taken together, they could sufficiently explain why the official results deviated significantly from nearly all of the polls conducted towards the end of the campaign period. While the answer must be left for readers to answer, it seems certain that if the outcome had been an Odinga win, even by a narrower margin than Ruto obtained, the media would have most certainly reported that “the pollsters were correct”, even if this result would have been outside these polls’ margins of error!
Even some of those committed to voting for Ruto were likely reluctant to risk getting on the “wrong side” of an expected Odinga government by declaring their true voting intentions.
Whatever the case, and despite the fact that far more use was made of such survey tools by the major presidential campaign teams (and also by many candidates below that level), it seems that “serious” survey firms may have to re-think certain aspects of their methodology, in terms of both the selection of respondents (for example, trying to discover why some people decline to be interviewed in case such non-participation might create a “silent” bias, even within particular ethnic groups) and the reliability of the answers they give to certain critical questions. Likewise, they may need to publish their final results in terms of several potential scenarios, beginning, perhaps, with variable voter turnout figures in both national and regional terms. Indeed, in his last pre-election blog, Hornsby, using such a multiplicity of factors – including the most recent polls – ‘guessed’ that Ruto would win within a 1 per cent margin – which is exactly what happened.
Such considerations raise one question this piece has yet to address: “What about the ‘correct’ Radio Africa/Star poll?” A valid question, but an answer seems elusive. In the US, following considerable embarrassment associated with the performance of a number of reputable pollsters in the last two elections, they sat down together to share their thoughts as to what ‘went wrong’, and what steps could be taken – mainly with regard to sampling models – to remedy such errors. But doing so required a level of data-sharing transparency that has no precedent in Kenya, where the few firms that conduct these surveys have never (to my knowledge) engaged in such a collective exercise, which would clearly have to include a comparison of the ethnic distribution of their samples, given the salience of this factor in voters’ choices.
Recall, however, that an early June poll by Radio Africa gave Odinga a six per cent lead, whereas late-May surveys by Infotrak and TIFA placed him ahead of Ruto by only 4 per cent. And in April, while a TIFA poll put Ruto ahead of Odinga by 7 per cent, Radio Africa gave the former DP an advantage of just 5 per cent. As such, the basis for Radio Africa’s ‘predictive success’ in that poll remains unknown, least for now.
But beyond any such “errors”, those involved in the conduct, dissemination and use of such data in a still-young democracy such as Kenya must not get distracted from the larger—and, it can be argued—more important question: Do such research tools contribute to the strengthening of democracy, both among those competing for office and those with the power to determine winners and losers—that is, the voters themselves?