Mathematical models allow us to extrapolate from information currently available about the state and progress of an outbreak, to predict future cases. In this article, we illustrate how, using mathematical models, the COVID-19 outbreak can be modelled mathematically to help prepare for the worst-case scenario and to develop a vaccination policy.
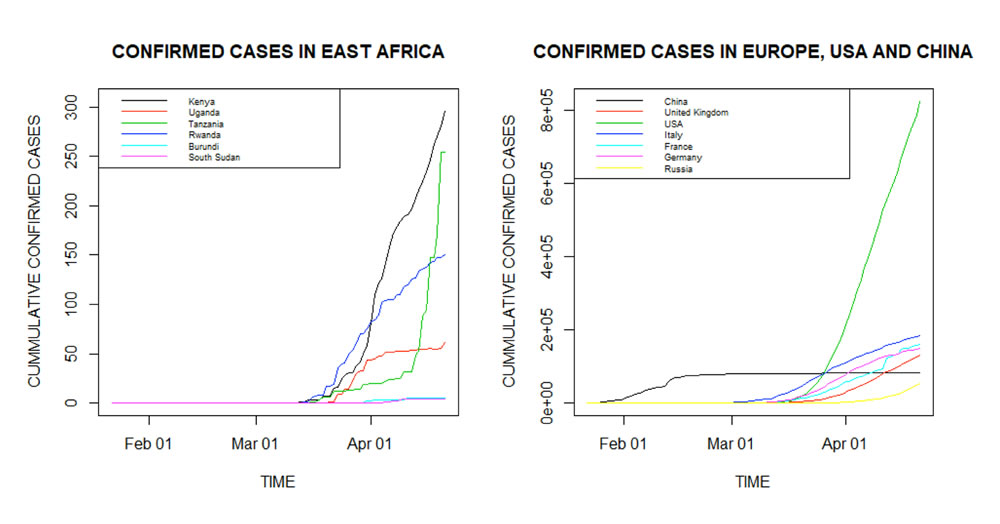
As can be seen from Figure 1, it is clear that the outbreak of COVID-19 in East Africa is taking a similar shape to that of China, USA and other European countries. The infections in China seem to have flattened by the last week of February 2020. East African countries seem to be at different phases of the disease outbreak. Kenya has the highest number of reported cases so far. This could be attributed to the relatively higher number of tests Kenya is carrying out compared to other East African countries. The United States has over 800,000 confirmed cases so far. The time it will take for the infections to significantly slowdown is of much interest to all the stakeholders.
Daily Confirmed Cases
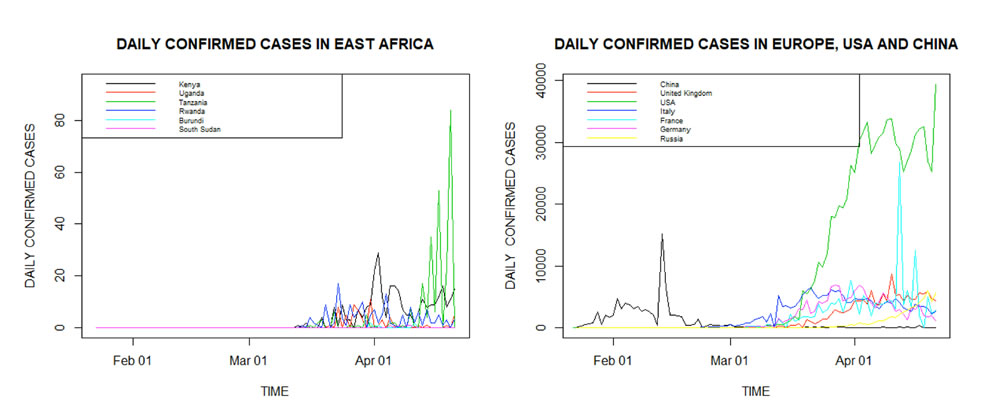
The daily confirmed cases in East Africa, China, USA and some selected countries in Europe are given in Figure 2. It is clear that the confirmed cases in East Africa are still very low compared to Europe, the US and China. This could be attributed to the relatively fewer tests in East Africa. However, Tanzania has reported the highest daily confirmed cases (84) followed by Kenya (29). Daily confirmed cases in China, UK, Italy, France, and Germany are declining while they are increasing in Russia. The trend is quite unstable in USA.
Daily Confirmed Cases Curve in Europe, USA and China
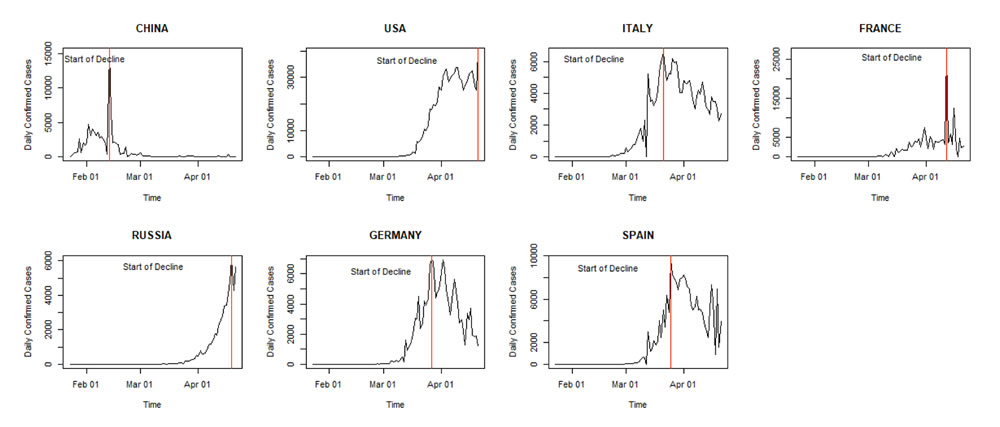
As can be seen from Figure 3, the infections in China, Italy, France, Germany and Spain are in the decline. On the other hand, the daily infections in the US and Russia are yet to start declining.
Data Source: Johns Hopkins University Center for Systems Science and Engineering (JHU CSSE)
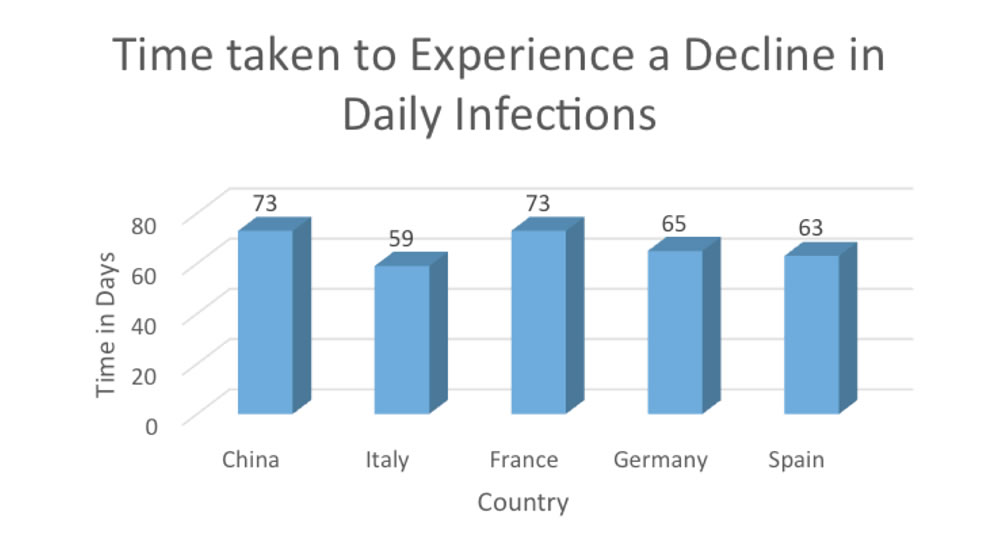
Considering that the follow-up in China started on 2 December 2019 while in all other countries in the world it started on 22 January 2020, Figure 4 shows the time it took China, Italy, France, Germany and Spain to experience a downward trend in daily infections.
Data Source: Johns Hopkins University Center for Systems Science and Engineering (JHU CSSE)
These countries took 67 days, on average, to experience a downward trend in daily infections. Considering the health facilities in these countries and the time they took to implement a total lockdown, 67 days seems to be the earliest time a country can take to experience a downward trend in COVID–19 infections taking into account the measures taken by these countries such as testing, lockdown, social distancing, surveillance and contact tracing. 140 days (about 5 months) is the minimum time any country will take to return to normalcy in terms of COVID-19.
Daily Confirmed and Recovered Cases
Figure 5 gives the daily confirmed and recovered cases in China and Kenya. It is clear that the number of recovered cases in Kenya is currently lower than the number of daily infections. The daily infections in Kenya seem to be increasing despite the country having experienced a decline around the second week of April 2020. This could be attributed to the increased number of daily tests. The recoveries in China had overshot the infections by the first week of March 2020.
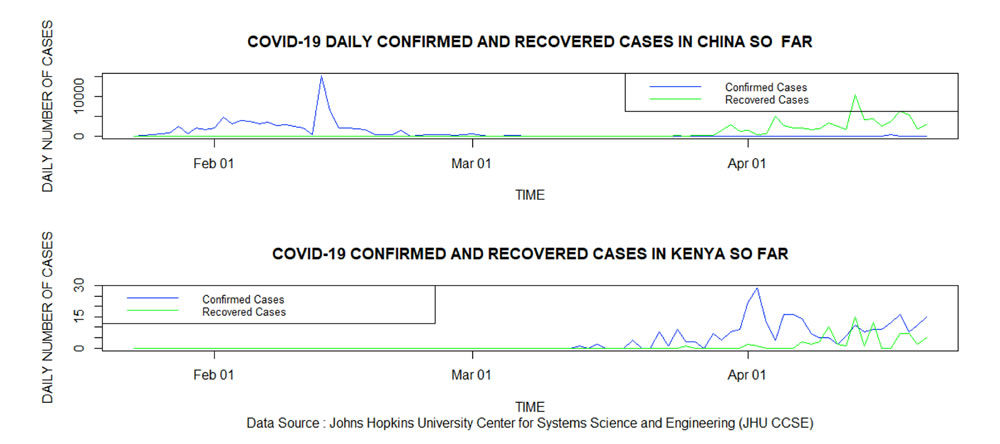
Data Source: Johns Hopkins University Center for Systems Science and Engineering (JHU CSSE)
Daily Recovered and Dead Cases in East Africa
Figure 6 gives the percentage of recovered and dead cases in East Africa. Burundi has reported the highest percentage deaths (20 per cent). South Sudan has not recorded any recoveries or deaths so far despite reporting four confirmed cases so far. Uganda and Rwanda have not reported any deaths so far. The percentage of recoveries in the two countries (Uganda and Rwanda) are the highest so far in East Africa. The percentage recovered is a key parameter in modelling of infectious diseases. Every country in the world will have its own recovery rate based on such factors as status of health facilities and mean age at infection.
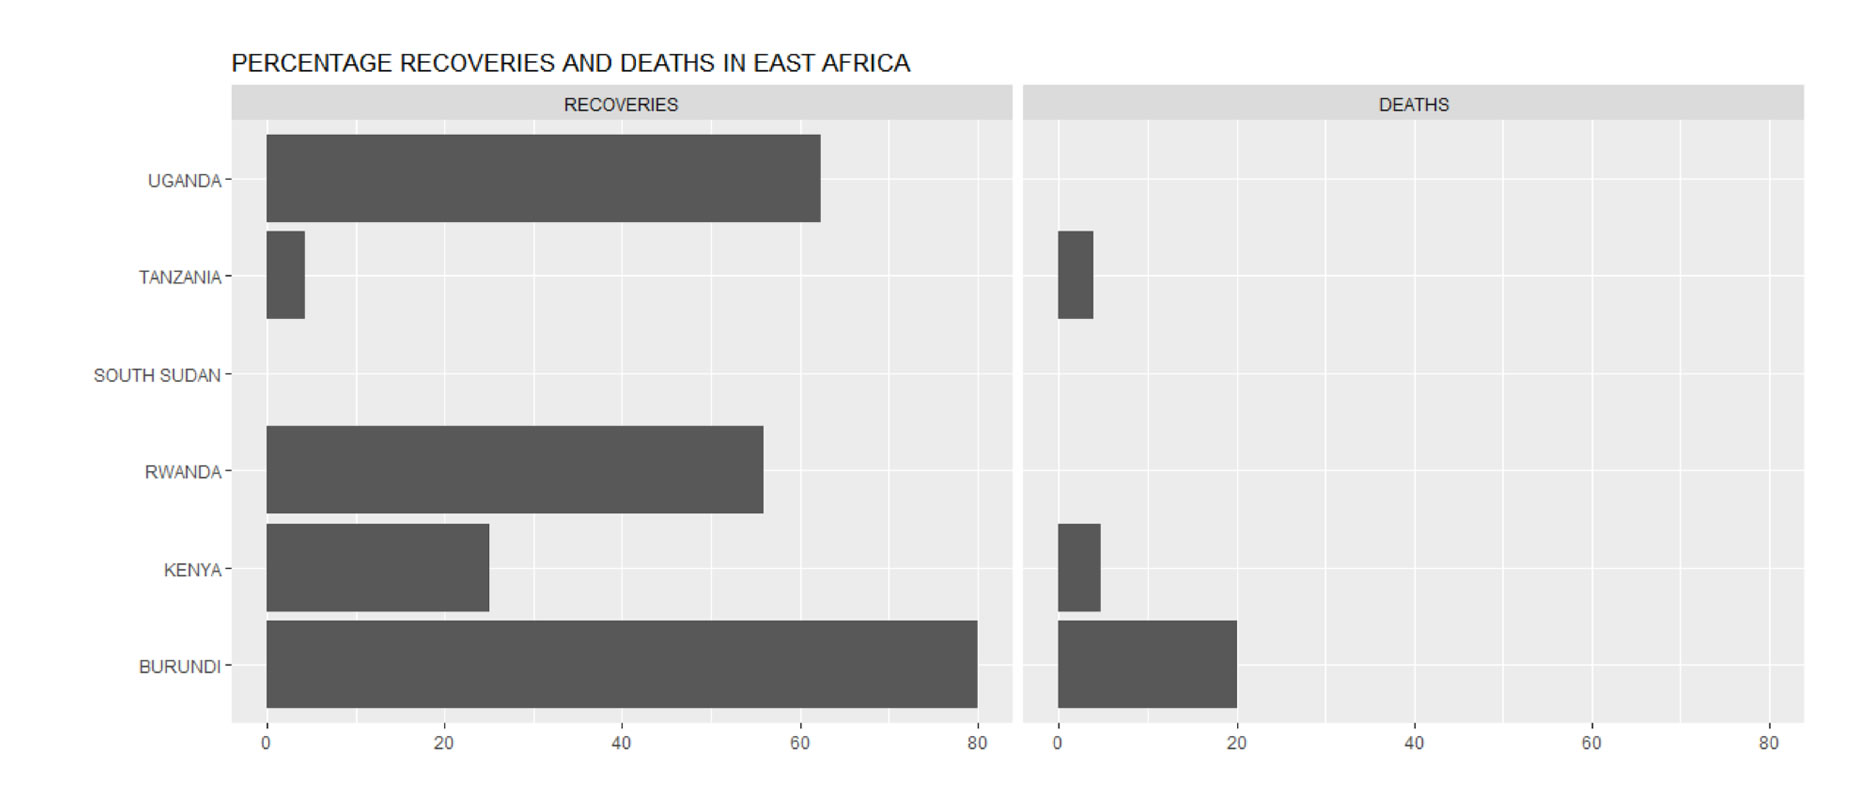
Data Source: Johns Hopkins University Center for Systems Science and Engineering (JHU CSSE)
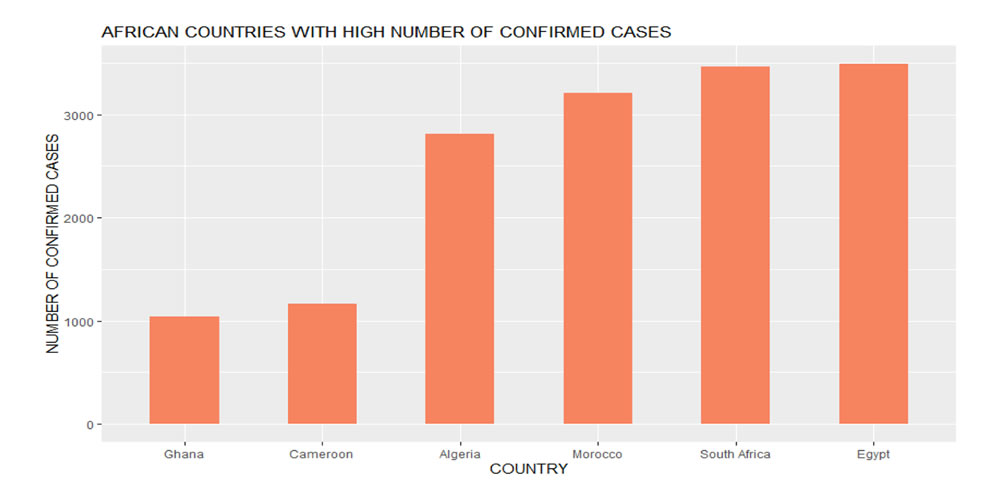
African Countries with the Highest Number of Confirmed Cases
As can be seen in Figure 7, Egypt, South Africa and Morocco have over 3,000 confirmed cases while Algeria has slightly over 2,500 cases. Ghana and Cameroon have slightly over 1,000 confirmed cases so far.
Data Source: Johns Hopkins University Center for Systems Science and Engineering (JHU CSSE)
Recoveries and Deaths in African Countries with the highest number of Confirmed Cases
As can be seen in Figure 8, Algeria has the highest recovery and death rates amongst the six countries. Furthermore, among the six African countries, only Algeria has a death rate higher than 10%. Ghana has the lowest death rate of the six African countries while having the highest number of confirmed cases.
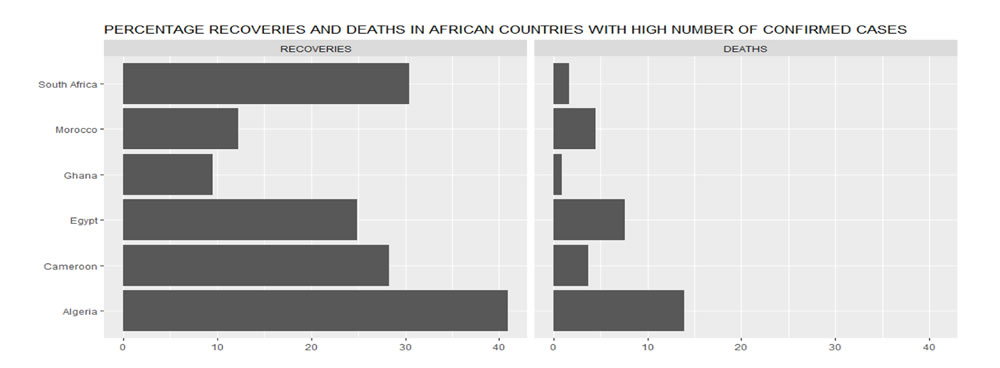
Data Source: Johns Hopkins University Center for Systems Science and Engineering (JHU CSSE)
Recoveries and Deaths in some selected countries outside Africa
Figure 9 gives the percentage of recoveries and deaths in China, the US and some selected countries in Europe. Surprisingly, recoveries in the UK are very low compared to other major economies in Europe. Also, the number of deaths in the UK are greater than the recoveries. This could be pointing to a strained National Health System (NHS). The recoveries are highest in China (92.6 per cent), an indication of the expected recovery rate in a well-developed country which took the necessary steps early enough. Similarly, a death rate of 5.5 per cent in China points to the expected long-term death rate in a well-developed country which took the necessary steps early enough.
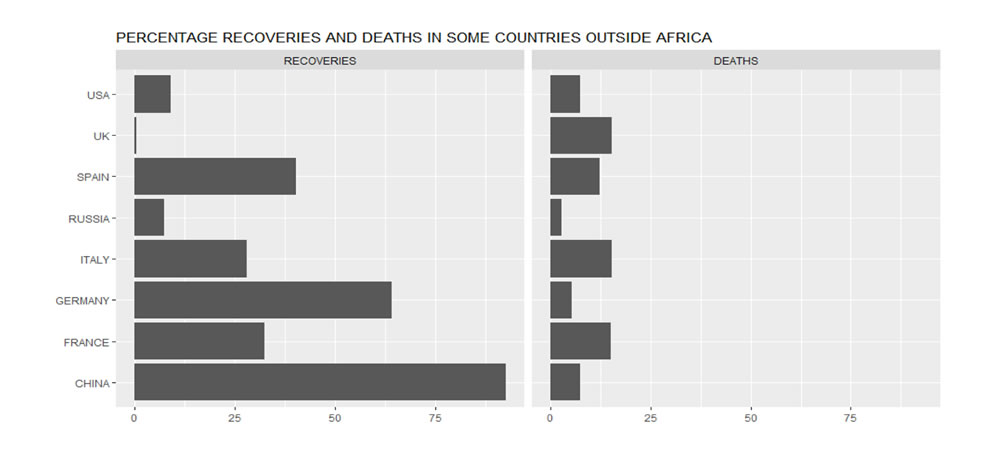
Data Source: Johns Hopkins University Center for Systems Science and Engineering (JHU CSSE)
Prediction of Infection in Kenya
The transmissibility of COVID-19 was assessed through the estimation of the reproduction number R, defined as the number of expected secondary cases per infected case. In the early stages of an outbreak, and assuming no immunity in the population, this quantity is also the basic reproduction number R0, i.e. R in a fully susceptible population.
Figure 10 gives the estimated reproduction number of 1.241. This estimate is derived from the available daily COVID-19 incidences in Kenya so far. A serial interval distribution with a mean of 7.5 days and a standard deviation of 3.4 days was used, similar to the COVID-19 Wuhan characteristics.
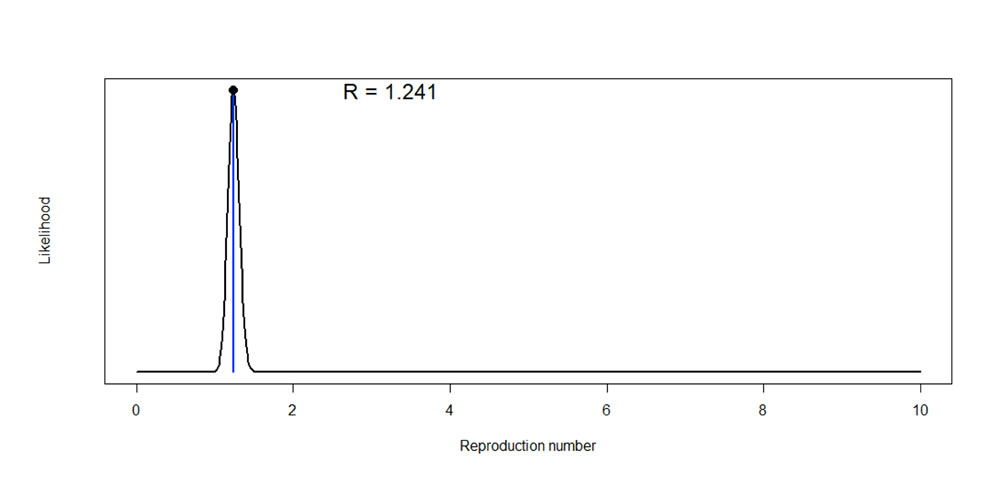
Data Source: Johns Hopkins University Center for Systems Science and Engineering (JHU CSSE)
Predicted Infections in Kenya for the next 5 days
Figure 11 gives the projected incidences in Kenya for the next five (5) days. For the country to experience a reduction in infections, measures must be taken to reduce the reproduction number by continuing to stress on social distancing, hand washing, etc. Infections can be minimised by implementing targeted total lockdown.
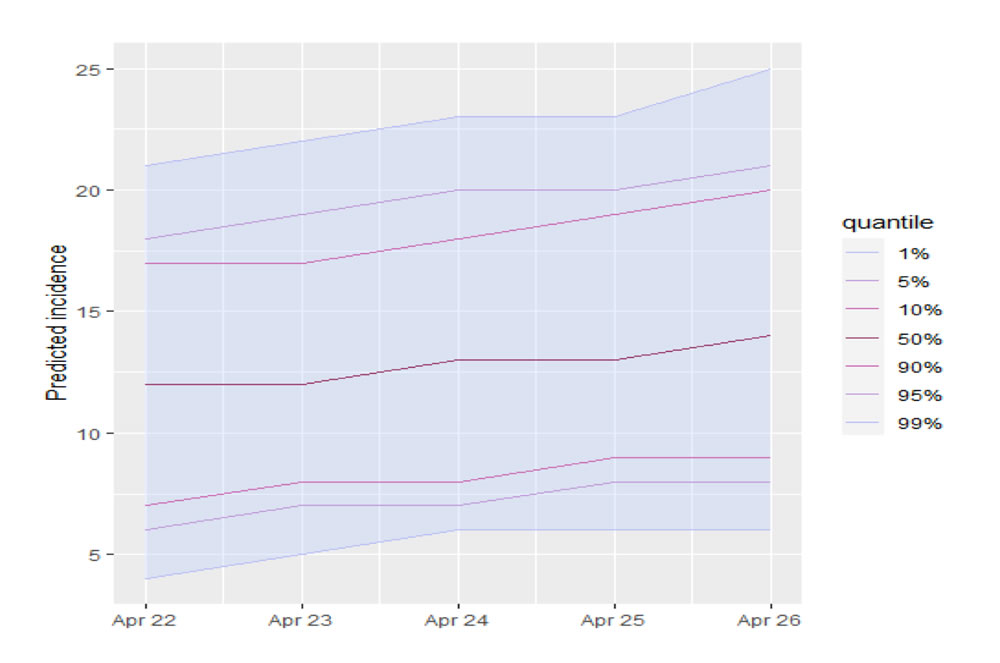
Source: Author
Table 1 shows the projected daily infections from 22/04/2020 to 26/04/2020. The upper limits can be taken as the worst-case scenario for the given transmission rate of 1.2 for about 600 daily tests for COVID-19 in Kenya. A similar analysis can be done for any other country whose daily incidences are available.
Table 1: Projected Infections in Kenya
|
Date |
Prediction |
95% Confidence Interval | |
| Lower Limit | Upper Limit | ||
| 22/04/2020 | 12 | 5 | 20 |
| 23/04/2020 | 12 | 6 | 20 |
| 24/04/2020 | 13 | 6 | 21 |
| 25/04/2020 | 13 | 7 | 22 |
| 26/04/2020 | 14 | 7 | 23 |