The geography of economic potential: Myths from the “White” Highlands
At 67,000 km2, Marsabit County is Kenya’s second largest county after Turkana (71,600 km2). It is just under 12 per cent of Kenya’s land mass. Before the discovery of wind power resources, it was known only as an arid and semi-arid conflict-prone region dominated by pastoralism. But according to the Marsabit Statistical Abstract published by the Kenya National Bureau of Statistics (KNBS), almost a quarter of the county, 16,000 km2 km, is arable land which receives 1000 mm of rainfall per year, high enough for large-scale rain-fed mechanised agriculture. I know of a hi-tech operation in Laikipia that is producing 25 bags per acre of maize with 650 mm of rainfall a year.
Let us do some simple math. If we use maize to benchmark the potential at a price of Sh2,000 a bag, that works out to Sh240 billion a year (16000 km2 is equivalent to 4m acres) This alone would rank as the fifth highest county GDP after Nairobi, Nakuru, Mombasa and Kiambu.
Kitui County (30,430 km2) is one third larger than Israel (22,145 km2), and receives about the same amount of rainfall. Over and above being food self-sufficient in everything other than grain, Israel exports $8 billion (Sh800 billion) worth of agricultural produce a year, 70 per cent more than our total marketed agricultural production on last year (Sh465 billion) and more than our total exports.
Economic potential is not a fixed endowment. It is a variable that is determined by investment. And of course it is dynamic. Before wind technology became technically and economically viable, Marsabit’s strong wind did not count as economic potential. The basic laws of economics don’t change. This assertion was just as true in 1965 when the government adopted the policy of concentrating public investment in the “high potential areas” which were defined as “areas having abundant natural resources, good land and rainfall, transport and power facilities, and people receptive to, and active in development” as it is today.
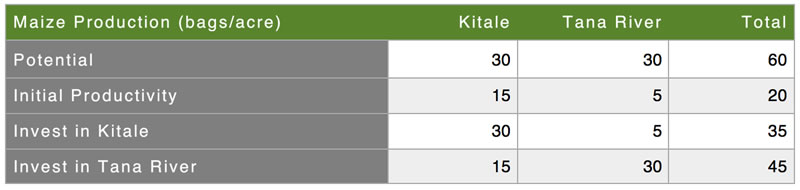
It is not just the geography of economic potential that the architects of the Sessional Paper got wrong. They also got the economics of investment wrong. Let me illustrate with a numerical example. We grow maize in Kitale but we could also grow maize in Tana River, as we’ve been trying to do lately. The potential yield is 30 bags per acre in both places. In “high potential” Kitale the yield is presently 15 bags per acre. In Tana River it is five bags. Where should we invest to maximise national output? For simplicity, let’s work with one acre of land in each region; investing to maximise yield in Kitale raises national output to 35 bags, investing in Tana River to 45 bags.
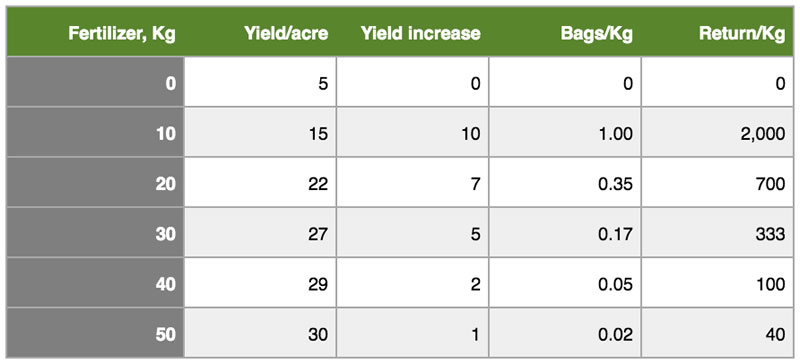
Investment is subject to an economic law known as diminishing marginal returns. Think of growing a maize crop, and fertiliser as capital. Let’s say the recommended application is 50kg/acre. The table below shows a hypothetical relationship between different quantities of fertiliser application, yield, and implied return to fertiliser investment (Columns 1 & 2). Column 3 shows incremental yield and Column 4 the additional yield expressed in bags of maize per kilo of fertiliser. The fifth column converts the production into monetary value calculated at Sh2,000 per bag of maize and Sh50 per kilo of fertiliser. A farmer who applies no fertiliser may harvest 5 bags. Applying 10 bags increases yield to 15 bags, which works out to a bag a kilo. But increasing from 40 to 50 kg increases maize yield by only 3 kg. In money terms, this is a loss of Sh10 per kilo of fertiliser. The maximum return on capital is reached somewhere between 40 and 50 kg of fertiliser per acre.
Consider a farmer who has five acres of land, and enough money for only 50 kilos of fertiliser. She can apply 50 kilos of fertiliser on one acre as recommended and harvest 30 bags. If she ploughs all five acres and applies 10 bags on each acre, she will harvest 75 bags. Obviously, which is more profitable depends on the other costs such as plowing, weeding, seeds, etc. It is doubtful though, that these costs could offset the 45-bag difference. Returns to capital behaves the same way; the more capital employed, the lower the return.
The first decade of independence witnessed very rapid agriculture-led growth that seemed to validate Sessional Paper No. 10’s “to those who have, more shall be given” public investment strategy. But this growth came primarily from adoption of coffee, tea and dairy farming by African smallholders, hitherto the preserve of white settler farmers and by the late 70s, this “low hanging fruit” was exhausted. Kenya’s agricultural productivity stagnated in the late 80s. With the exception of export horticulture, there has been no new source of agricultural productivity growth since the 60s. Consequently, Kenya’s cost of producing food is now the highest in the region.
The “high potential areas” now cry foul about cheap imports of everything that they produce, pleading to be protected from Ugandan maize and eggs and milk and Tanzanian vegetables. Expensive food translates into poverty and loss of international competitiveness. At Sh3,000 per bag (Sh30/kg), Kenyan maize costs close to double the world price ($160 per ton or Sh16/kg), while the factory gate of sugar ($800/ton is two and half time the world price ($280/ton). When food is expensive, people have less disposable incomes to spend on other things. It also makes the country’s labour expensive vis à vis competitors where food is cheap, for example South Asia where $80 (Sh8.500) is a decent wage for EPZ workers. We keep asking how it is that we fell behind East Asian countries; the flawed trickle-down economics of Sessional Paper No.10 is one of the reasons.
The free loading bogeyman: Who pays what tax?
The inaugural county economic data published by the KNBS last year put the 2017 Gross County Product (GCP) of Nyandarua and Kwale at Sh245 billion and Sh86 billion respectively, that is, Nyandarua’s economy is about three times as big as Kwale’s. But Nyandarua’s economy is one of the country’s least diversified, with agriculture accounting for 86 per cent. Kwale’s on the other hand is quite diversified; agriculture accounts for 47 per cent, the rest being tourism-related services, mining (titanium), quite a bit of manufacturing, construction and real estate services.
The national tax yield is currently in the order of 15 per cent of GDP. If Nyandarua was to pay its fair share, based on an estimated 2019 GCP of Sh296 billion (obtained by adjusting the national nominal GDP growth rate), it would contribute Sh44 billion to the national tax kitty. It is hard to see where this tax would come from. It is doubtful whether there is a single entity which pays Sh500 million in taxes in Nyandarua. I would challenge the Kenya Revenue Authority to show that it raised Sh5 billion in direct taxes in Nyandarua last year.
Base Titanium’s 2019 annual report shows it paid direct taxes to the tune of Sh2.5 billion (Sh1.5 billion in royalties and Sh1 billion in income tax). Including indirect taxation such as payroll tax and taxes paid by suppliers, the total is over Sh3 billion. Tourism generated Sh200 billion last year, and about 40 per cent of that (Sh80 billion) is tax. The Coast accounts for 43 per cent of hotel occupancy. If we apportion Kwale a third of that, we arrive at an estimate of Sh10 billion in tax. Add income taxes paid by other industries (sugar, steel, construction, real estate) and wealthy residents and we are will be approaching Sh15 billion.
Kwale is also more populous, with 867,000 people compared to Nyandarua’s 686,000 as per the 2019 census. Average household expenditure is comparable in both counties, with Kwale at Sh6,470 and Nyandarua at Sh6,690 per person. If we were to factor in indirect consumption taxes paid by households, such as VAT, Kwale still comes out ahead at 25 per cent more. It is thus likely that overall, Kwale, with an economy a third the size of Nyandarua pays three times the taxes.
Central Kenya counties are not owed more money by the rest of the country. They do not contribute more tax, and may even contribute less than their equitable share. If they have evidence to the contrary, they should table it. In addition, the country’s highest economic growth potential lies elsewhere. There is no rational economic or social development criteria that would justify redistributing money to central Kenya.
Where does the National Government money go?
Since coming into being seven years ago, county governments have—excluding last financial year (up to FY18/19)—secured Sh1.66 trillion of nationally raised revenue. County governments are mandated to spend 30 per cent on development projects, which they seldom do (it’s a bad policy but that’s another matter). This means that the maximum they could have spent on development projects is Sh500 billion, an average of Sh11 billion per county. Over the same period, the national government’s development expenditure is Sh2.94 trillion. In effect, the national government has spent at least 11 times more than the counties on development projects (the National government’s total expenditure comes to Sh11.4 trillion).
We should be seeing at least ten times the impact of national government development. Makueni County government’s Sh140 million women and children’s hospital ought not to be the talk of the county, and the country. Makueni people should be seeing the equivalent of 70 projects comparable to this hospital build by the national government. It is doubtful that there is any county that can show more national government projects than county ones, despite the national government spending 10 times the money.
Where are these national government projects? We do not know. What we can say for sure is that northern Kenya is not getting its fair share. If population were used as a criteria as proposed, and north-eastern counties (Mandera, Garissa, Wajir) had received their rightful share based on their share of national population (5 per cent), the national government would have spent Sh147 billion there. How many kilometres has it tarmacked? To the best of my knowledge, zero.
It is often suggested that northern Kenya counties ought to reduce dependency on the more developed south by developing their own revenue base. It is even suggested that pastoralism is an antiquated mode of production and it is time that the region abandoned or modernised it.
Livestock production (cattle, sheep and goats) contributed Sh115 billion to the economy last year—the second largest agricultural sub-sector after export horticulture (Sh145 billion) although ordinarily it would be third after tea, which went down from Sh127 billion to Sh104 billion in 2018. Livestock production was more than three time the value of cereals (Sh36 billion), seven times sugarcane (Sh17 billion) and more than ten times the value of coffee (Sh10 billion). It is also worth noting that northern pastoralists do not receive subsidised inputs or regular bailouts that some of these other high potential producers receive on a regular basis.
The most readily available strategy for northern Kenya to develop its revenue base is to add value to livestock. Few agricultural products can match the value addition potential of livestock —at least eight times the value of a live animal. On current output, this is potentially a Sh800 billion livestock industry. And according to analysis by the government policy think tank KIPPRA (Kenya Institute of Public Policy Research and Analysis), the livestock industry leads in employment generation potential. But to unlock this potential, northern Kenya needs the physical infrastructure linking it to market so that instead of trekking live animals to be slaughtered near the market, they can be slaughtered at source so as to retain the hides for processing.
The Constitution of Kenya established the Equalisation Fund for this purpose, for the national government “to provide basic services including water, roads, health facilities and electricity to marginalised areas to the extent necessary to bring the quality of those services in those areas to the level generally enjoyed by the rest of the nation”. The Constitution stipulates that 0.5 per cent of revenue be put in, and retained in the fund. A decade on, the Fund has not been operationalised, even though a provision is dutifully reflected in the budget every year. If indeed the money is set aside, the fund should have upwards of Sh50 billion.
The evident resolve to take away money from northern Kenya, while at the same time withholding money that is the region’s constitutional entitlement, begs the question whether the true intention of the one-man-one-shilling formula is to increase the money flowing to central Kenya or to keep northern Kenya poor and marginalised.
Land or people? Why money should follow function
Kirinyaga (Pop. 610,000, 1,478 km2) and Nyamira (Pop. 605,000, 913 km2)) have about the same population and are equally small and so, on both population and area, they’d come out about even. In Kirinyaga, 52 per cent of households have piped water in their compounds. In Nyamira only 7.7 percent do, as per the Integrated Household Budget Survey (IHBS) 2015/16. Similarly, Migori (Pop. 1.12 m) and Murang’a (Pop. 1.07m) are in the same population bracket, but 35 per cent of Murang’a households have piped water. In Migori, it is 1.6 per cent. Busia (Pop. 890,000) might feel it has a leg up on Nyeri (Pop. 759,000) population-wise, but the IHBS 2015/16 puts Busia’s poverty incidence at 69 per cent against Nyeri’s 19 per cent. Busia’s interests in terms of how money should be allocated are more aligned with those of their northern Kenya poverty peer group.
Why then would Busia, Migori or Siaya for that matter conclude that their interests are aligned with those of equally populous counties as opposed to those with which they share needs? Residents of these and other counties in a similar situation are owed an answer to this question. Population per se is not a criteria for allocation of revenue. It has been used as a proxy for the cost of providing services. If Kirinyaga County had only one hospital located at Kerugoya, every resident would be able to access it in less than 45 minutes. To provide the same quality of access in Marsabit would require 45 facilities, and roads leading to them. Obviously, it is difficult for Marsabit to equip 45 facilities to match Kirinyaga’s one hospital. Population density also matters. Incidence of poverty matters. Climate (e.g. malaria incidence) matters.
On revenue sharing by formula
Consider a Ward with three villages allocated NGCDF (National Government Constituencies Development Fund) money for one project. One village proposes a secondary school, the second a dispensary and the third a tarmac road. How to choose? An economic axiom known as the Arrow Impossibility Theorem posits that there is no win-win solution for this problem and thus problems of this nature are solved by give and take. Formulas such as rates of return are helpful for illuminating discussion but they are not of themselves a solution. There is no scientific method of adding up and subtracting the continued suffering from lack of healthcare and the income loss on produce that fails to get to market during the rains from the happiness of having a secondary school. The only human institution that thrives on self-interest is commerce. This should disabuse the Senate and the country at large of the idea that we can tinker with a formula until it pleases everyone. This impasse is political, and not politics of the best kind. Put the formulas aside and return to reason.